I've been writing about Amazon Sales Ranks since the late 90's, during which period both the sales rank algorithm and my approach for reverse engineering the ranks has changed several times. In the early years, I relied heavily on Amazon's public statements about their dollar sales volume and how it was divided up, computed an average price, used a limited number of data points to fix a curve and plotted it on log-log paper. In later years I shifted to numbers for my self published books and ebooks, and data sent to me by friendly publishers. It all got very confused a couple years ago when Amazon started including marketplace sales in the ranks, and I was forced to rely more heavily ebook data. I also stopped trying to estimate sales for the top three decades of the curve, the top 1000 titles.
But thinking about how many extra sales would result from a book moving from an average rank of 100 to 50 for a few days got me curious about those top sellers. I decided to do something I'd been procrastinating for some time and try to see if I could get a feel for what's going on at the top of the curve with Aaron Shepard's Rank Checker, which also displays a stock number. Some of the limitations of this method are that it doesn't include marketplace sales, the stock number often moves up as new stock is received into the Amazon system (at least that's what I hope it is:-), and perhaps most importantly, the ranks themselves are changing every hour. While the top two or three books may be more or less nailed in place for long periods of time, most books move every hour, which is why an average rank must be estimated. Another important factor is that the proportion of marketplace sales versus Amazon stock sales is not proportional for all titles. A top seller that's been in print for years may see half of it's sales coming through the marketplace, while a brand new title may see virtually 100% of it's sales coming from Amazon inventory.
All that said, here are some observations about the meaning of the top Amazon sales ranks for a quiet week in the middle of July, or the first few days of the week. It's just after 2:00 PM EST as I'm writing this entry, and the stock of the #2 seller on Amazon has dropped 38 copies in the last half hour, with me checking every couple minutes. The top seller is the new Harry Potter book which hasn't been released yet. The same #2 title moved 173 copies during a three hour period yesterday evening, and 261 copies during the two and a quarter hours I was out for lunch. Assuming I didn't miss a restocking during any of these periods (and they're normally pretty obvious), the #2 rank on Amazon today is selling about 2,000 copies a day. Sure, there's a huge fudge factor in there (though I didn't list all of my data points), but I'll bet it's a lot more accurate than any other number you may have in mind.
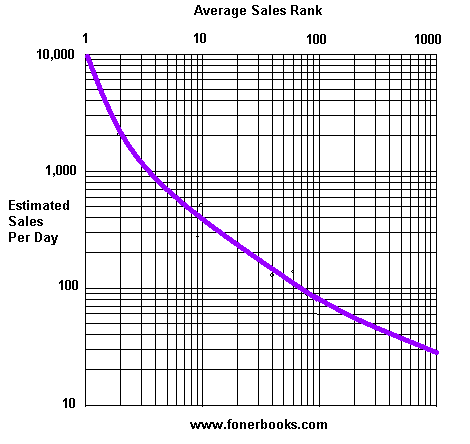
One of the best ways to convince people that guesstimates are in fact data is to plot a graph.

The little marks that aren't buried under the thick blue line are my data points, all of which required some averaging before plotting. There is no data point suggesting that the the #1 book (Harry Potter in this case) is selling 10,000 books a day. It could just as easily be 4,000 or 40,000. If you compare the graph with my permanent sales rank article, you'll see that this graph puts the 1000th rank book at 18 copies a day, while the old graph puts the 1000th rank seller at 100 copies a week. That's pretty darn close considering I wasn't trying! And yes, it really is time I cleaned that old graph up.
So, take it with a shaker of salt, or go nuts watching Amazon stock numbers, try adjusting for Marketplace, time of day, week and year, check continually so you can catch stock adjustments, and plot your own graph. I'm either too lazy to set up an automated script to do it, or too skeptical of the results to bother. And back to the Cutts effect. According to this graph, a move from a rank of 100 to 50 for a few days would sell between 100 and 200 books, so not a horrible guess. Wish I could blog like Matt, like Matt. Be like Matt. C'mon, am I the only one who remembers the "Be like Mike" commercial?
No comments:
Post a Comment